
Mynd:1973 Atlantic hurricane season summary map.png

Stærð þessarar forskoðunar: 800 × 494 mynddílar Aðrar upplausnir: 320 × 198 mynddílar | 640 × 396 mynddílar | 1.024 × 633 mynddílar | 1.280 × 791 mynddílar | 3.000 × 1.854 mynddílar.
Upphafleg skrá (3.000 × 1.854 mynddílar, skráarstærð: 3,99 MB, MIME-gerð: image/png)
| Lýsing |
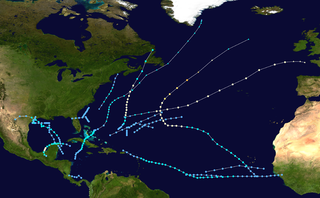
English: This map shows the tracks of all tropical cyclones in the 1973 Atlantic hurricane season. The points show the location of each storm at 6-hour intervals. The colour represents the storm's maximum sustained wind speeds as classified in the Saffir-Simpson Hurricane Scale (see below), and the shape of the data points represent the type of the storm.
Tropical depression (≤38 mph, ≤62 km/h)
Tropical storm (39–73 mph, 63–118 km/h)
Category 1 (74–95 mph, 119–153 km/h)
Category 2 (96–110 mph, 154–177 km/h)
Category 3 (111–129 mph, 178–208 km/h)
Category 4 (130–156 mph, 209–251 km/h)
Category 5 (≥157 mph, ≥252 km/h)
Unknown
Storm type |
| Uppruni | Created using Wikipedia:WikiProject Tropical cyclones/Tracks. The background image is from NASA [1]. The tracking data is from the National Hurricane Center's Atlantic hurricane database |
| Höfundarréttarhafi | Cyclonebiskit |
| This work has been released into the public domain by its author, Cyclonebiskit. This applies worldwide. In some countries this may not be legally possible; if so: Cyclonebiskit grants anyone the right to use this work for any purpose, without any conditions, unless such conditions are required by law. |
Breytingaskrá skjals
Smelltu á dagsetningu eða tímasetningu til að sjá hvernig hún leit þá út.
| Dagsetning/Tími | Smámynd | Víddir | Notandi | Athugasemd | |
|---|---|---|---|---|---|
| núverandi | 9. júní 2013 kl. 18:26 | | 3.000 × 1.854 (3,99 MB) | Supportstorm | Higher resolution |
| 28. september 2009 kl. 17:03 |  | 1.024 × 633 (564 KB) | Cyclonebiskit | {{Information |Description={{en|Track map of the 1973 Atlantic hurricane season. The points show the location of the storm at 6-hour intervals. The colour represents the storm's [[:w:maximum sustained wind|maximum sust |
Skráartenglar
Það eru engar síður sem nota þessa skrá.
Altæk notkun skráar
Eftirfarandi wikar nota einnig þessa skrá:
- Notkun á en.wikipedia.org
- 1973 Atlantic hurricane season
- Template:1973 Atlantic hurricane season buttons
- Tropical Storm Gilda (1973)
- Wikipedia:Good topics
- Hurricane Brenda (1973)
- Tropical Storm Delia (1973)
- Tropical Storm Christine (1973)
- Wikipedia:Featured and good topic candidates/1973 Atlantic hurricane season/archive1
- Wikipedia:Featured and good topic candidates/Featured log/October 2009
- Wikipedia:Featured and good topic candidates/Good log/October 2009
- Wikipedia:Featured topics/1973 Atlantic hurricane season
- Notkun á es.wikipedia.org
- Notkun á pt.wikipedia.org
- Notkun á ru.wikipedia.org
- Notkun á zh.wikipedia.org